
1. Introduction
Climate change is driven by the accumulation of greenhouse gases (GHGs) in the atmosphere, and according to the International Energy Agency, global energy-related CO2e emissions reached a record 37.4 Gt in 2023. Although industry and power generation dominate national inventories, household consumption (commuting, electricity, food, shopping, waste and water) contributes a substantial share, so individual choices matter. Many mitigation behaviours also reduce household costs, which makes personal action both an environmental and an economic opportunity.
Yet individuals rarely know which of their decisions matter most. Online carbon calculators try to close this gap, but reviews report that they are inconsistent in how closely they follow IPCC guidance and are often designed for a single context. Most are one-off questionnaires that return a single annual number and show nothing about how behaviour changes from month to month. Studies of carbon-tracking apps also show that uptake depends on whether the tool is easy and rewarding to keep using, which calls for history, feedback and some form of motivation.
Artificial Intelligence (AI) can strengthen such a tool in three complementary ways. Machine-learning models can predict where a user’s emissions are heading and group users with similar emission profiles. Large language models (LLMs) can turn structured activity data into plain-language, personalised tips and can answer user questions about sustainability. Lowlatency LLM inference matters because the advice is shown inside an interactive application. There is also a design tension: AI has a carbon cost of its own, and deep-learning research in recommender systems has been found to emit far more CO2e than research using traditional models. For the predictive part of the system we therefore prefer lightweight, well-understood methods: Random Forest and K-means. To address these needs, this paper introduces the AI-Based Carbon Footprint Tracker, a web platform with a React, Tailwind CSS and Vite front end, a PHP back end, a MySQL database, machine-learning analytics and an LLM service accessed through the Groq API. The paper presents the system flow, mathematical formulation and a synthetic-data evaluation of the analytics.
2. Review of Literature
A review of recent literature shows steady progress in individual components of carbon tracking, while highlighting the absence of an integrated platform that combines activity tracking, prediction, user profiling, LLM-based guidance and engagement features.
1.Behaviour-Oriented Carbon Apps – Jasmy et al. (2024) developed Tanaffas, which combines GPS trip tracking, augmented-reality item scanning, a chatbot and a points-based reward system on a Firebase back end. A 30-day study with ten users found a significant rise in subjective norms (t(9) = 4.2, p = 0.002) but not in attitudes or behavioural intentions. Its calculator is a simple arithmetic step and it includes no forecasting.
2.Behavioural-Theory-Based Systems – Lin (2016) introduced the Personal Carbon Footprint Management System (PECAFOMS) for high-school students, using persuasive technology and behavioural theory. The educational focus is valuable, but the narrow audience and reliance on user motivation limit wider applicability.
3.Adoption of Carbon-Tracking Apps – Hoffmann et al. (2022) investigated what drives consumers’ intention to adopt carbon-footprint tracking apps, showing that engagement, and not only calculation accuracy, decides whether a tool is used at all.
4.Carbon Footprint Calculators – Peter et al. (2017) reviewed footprint calculators (in an agricultural-energy context) and highlighted inconsistent adherence to IPCC guidelines and context-specific designs, which weakens the reliability of their results.
5.Emission Prediction with Dynamic Coefficients – Yu et al. (2023) predicted community electricity-related emissions using a dynamic emission coefficient of the power system, showing that emission factors can vary over time. The work operates at community level and does not engage individual users. 6.Machine Learning for Individual Action – Rolnick et al. (2019) outline how machine learning can estimate an individual’s footprint from personal data and model behaviour to identify high-impact actions.
7.Gamification for Pro-Environmental Behaviour – Ouariachi et al. (2020) analysed six gamified platforms and concluded that gamification can help educate people and motivate pro-environmental action when designs combine extrinsic rewards with intrinsic motivators. The study is qualitative and based on a small sample, so its conclusions are tentative.
8.LLMs for Climate Action – Sgaramella and Bilancini describe a planned online experiment in which an LLM-based chatbot helps users choose lower-impact foods by addressing both motivation and practical barriers; the project description reports no results yet. On the engineering side, the Groq documentation states that its API is mostly compatible with OpenAI’s client libraries, so existing applications can be pointed at it.
9.Emerging AI-Based Trackers – EcoPilot and CARBONLY describe AI-assisted trackers with personalised tips, analytics, progress tracking and chatbots. Evaluation details were not reported in the descriptions we could access.
10. Carbon Cost of AI – Wegmeth et al. (2025) analysed 79 papers from ACM RecSys 2013 and 2023 and found that deeplearning papers emit roughly 42 times more CO2e than traditional-model papers, which motivates lightweight methods where they are sufficient.
Existing research addresses several parts of personal carbon management, including emission estimation, behavioural engagement, activity monitoring and automated guidance. However, these functions are not always available together in a single workflow. This project brings them together by combining activity-based CO2e calculation with monthly trend analysis, emission forecasting, user profiling and personalised sustainability recommendations. The integrated design is intended to help users understand not only their current environmental impact but also which changes may reduce their future emissions.
1.1 Problem Statement
Contemporary personal carbon tools suffer from five weaknesses: (i) static, one-time calculation without activity history or trends; (ii) generic rather than personalised advice; (iii) no forward-looking view of where emissions are heading; (iv) weak long-term engagement; and (v) inconsistent or opaque emission factors.
There is therefore a need for a web-based tracker that records activities across everyday categories, calculates emissions transparently, shows history and trends, predicts next-month emissions, groups users by emission profile, generates personalised LLM-based recommendations, and motivates users through a leaderboard and badges.
1.2 Objectives
The primary goal of this project is to design and validate an AIdriven carbon footprint tracker following the system flow in Fig. 1. The specific objectives are:
1.Activity Tracking and Calculation – to let users add activities in seven categories (transport, electricity, food, shopping, waste, water and others) and to convert them into CO2e using a stored emission-factor table.
2.History, Insights and Reports – to present daily, weekly and monthly history, category-wise breakdowns, trend graphs and comparisons on a dashboard.
3.Prediction and Profiling – to predict next-month emissions with a Random Forest and to group users by emission profile with K-means clustering.
4.LLM-Based Personalised Guidance– to generate personalised recommendations, tips, savings estimates, activity insights and answers to user queries through the Groq API, and to store the responses.
5. Engagement and Secure Design – to motivate users with a leaderboard and badges, and to protect user data and the API key.
3. Methodology
The proposed system follows the flow shown in Fig. 1. After the splash screen and authentication, the user reaches the dashboard and then the feature modules. The React front end calls the PHP API endpoints; the business logic layer calculates emissions and applies validation; database operations read and write MySQL; and the AI services return recommendations that are stored with the other records. Fig. 1 shows the complete system flow diagram, the technology stack and the database tables.
The methodology is described layer by layer, following the diagram:
- Frontend Modules and Navigation – The front end is built with React, Tailwind CSS and Vite and has ten modules. (1) Splash / Welcome greets the user. (2) Authentication offers login, sign-up and a forgot password option. (3) Dashboard (Home) shows the total carbon footprint in kg CO2e, a donut chart of category shares and the change from last month. (4) Add Activity records transport, electricity, food, shopping, waste, water and other activities. (5) Activity History lists daily, weekly and monthly records. (6) Insights & Reports provides category-wise breakdowns, trend graphs and comparisons. (7) AI Insights & Recommendations shows AI suggestions, personalised tips and potential savings. (8) Prediction shows the predicted footprint for next month. (9) Profile & Settings holds personal information, preferences, notifications and the Groq API key. (10) Leaderboard & Badges shows rankings and
earned badges. The numerical values drawn in Fig. 1 (for example 247 kg CO2e and 220 kg CO2e) are placeholders of the interface design and not measured results. 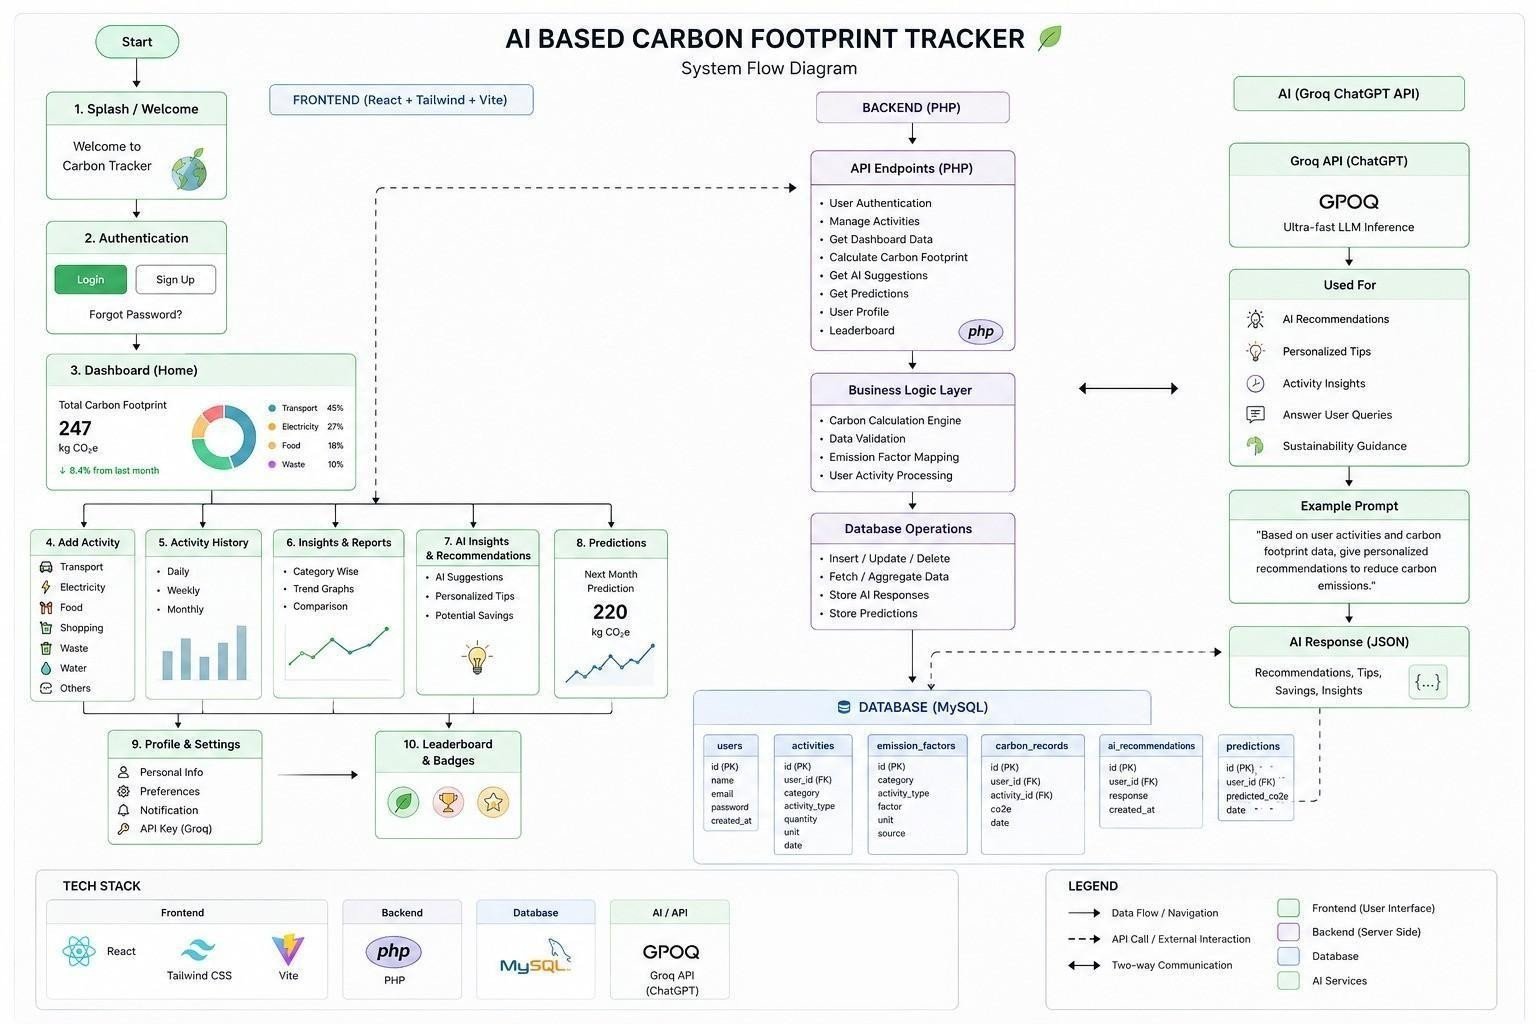 Fig. 1. System Flow Diagram of the AI-Based Carbon Footprint Tracker |
- PHP API Endpoints – The front end sends requests to the PHP back end, which exposes endpoints for user authentication, managing activities, getting dashboard data, calculating the carbon footprint, getting AI suggestions, getting predictions, the user profile and the leaderboard.
3.Business Logic Layer – This layer contains the carbon calculation engine, data validation (types, ranges and required fields), emission factor mapping (matching each activity to a factor in the emission_factors table) and user activity processing (aggregation by category and period).
4.Database Operations and Schema – Operations are insert, update and delete, fetch and aggregate data, store AI responses and store predictions. The MySQL database has six tables: users (id, name, email, password, created_at); activities (id, user_id, category, activity_type, quantity, unit, date); emission_factors (id, category, activity_type, factor, unit, source); carbon_records (id, user_id, activity_id, CO2e, date); AI_recommendations (id, user_id, response, created_at); and predictions (id, user_id, predicted_CO2e, date). Foreign keys link records to users and activities.
5.AI Services through the Groq API – The back end communicates in both directions with the Groq API, which provides low-latency LLM inference through an interface that is mostly compatible with OpenAI’s client libraries. It is used for AI recommendations, personalised tips, activity insights, answers to user queries and sustainability guidance. The back end sends a prompt such as “Based on user activities and carbon footprint data, give personalised recommendations to reduce carbon emissions” together with the user’s summarised data, receives a JSON response containing recommendations, tips, savings and insights, and stores it in ai_recommendations.
- Current Analysis (Implemented) – The business logic layer converts each activity into CO2e and aggregates by category and by day, week or period within the recorded month. It produces the total footprint, the category shares shown in the donut chart, and the savings estimate when an activity is swapped for a lower-factor alternative. These are descriptive analyses of past activity. They are not predictions.
- Proposed Forecasting and Profiling (Not Yet Validated) – The following are design proposals for when sufficient data exists. Random Forest regression would predict next-month total emissions from a user’s monthly history, with features such as recent monthly totals, category shares and a seasonal encoding. It needs several months per user to train and a timeordered split (train on earlier months, test on later ones); the features, hyperparameters and validation protocol will be fixed when data allow. K-means clustering would group users by category-share profile. It requires a larger user base, and the number of clusters would be chosen by silhouette score.
3.1 Mathematical Model
1.Carbon Footprint Calculation – Purpose: Converts each logged activity into CO2e (carbon calculation engine).
Ec = Σ ic qi · fi, E = Σc Ec (1)
How it works: q is the quantity of activity i (km, kWh, kg or litres) and f is its factor in kg CO2e per unit, taken from emission_factors. The product is saved in carbon_records. For example, with illustrative factors, 15 km by petrol car (0.17 kg/km) gives 2.55 kg and 100 kWh of grid electricity (0.73 kg/kWh) gives 73 kg.
2.Category Share, Monthly Change and Potential Savings – Purpose: Produces the dashboard percentages, the change from last month and the savings estimate.
| pc = (Ec / E) × 100 | (2) |
| Δt = (Et − Et−1) / Et−1 × 100 | (3) |
| ΔE = q · (fcurrent − falternative) | (4) |
How it works: pc is the share of category c in the donut chart; Δ is the percentage change in the monthly total (a negative value means a reduction); and ΔE is the potential saving when an activity is replaced by a lower-factor alternative. Status: pc and ΔE are implemented analyses of the recorded month; Δ is a design-only formula and needs at least two months of data.
3.K-means Clustering (Proposed, requires multi-user data) – Purpose: Groups users with similar emission profiles.
min Σk Σx Sk ‖x − μk‖² (5) s(i) = (b(i) − a(i)) / max{a(i), b(i)} (6)
How it works: Each user would be described by the seven category shares and the mean monthly total, standardised. Kmeans assigns users to k clusters by minimising the withincluster squared distance to the centroids μk, and k is chosen by the highest mean silhouette value s(i), where a(i) is the mean distance to points in the same cluster and b(i) the smallest mean distance to another cluster. This model is proposed and has not been validated on the 10-user pilot data.
4.Random Forest Next-Month Prediction (Proposed, requires multi-month data) – Purpose: Would predict next month’s footprint for the Predictions module.
Êt+1 = (1/B) Σb Tb(xt) (7)
How it works: A forest averages the predictions of B decision trees Tb trained on bootstrap samples with random feature subsets. The feature vector xt would be built from t recent monthly totals, category shares and a seasonal encoding of the calendar month. The number of trees, tree depth and exact features will be fixed only when enough monthly data exist for time-ordered training and validation. No trained model or accuracy result is reported in this paper.
5.LLM Recommendation Generation – Purpose: Turns the user’s data into personalised guidance.
R = LLM( Prompt( Ec, pc, Δ, Êt+1, cluster ) ) (8)
How it works: The business logic layer builds a prompt from the user’s category totals and shares, without names or e-mail addresses. The terms Δ, Êt+1 and cluster label are included only once the corresponding modules are implemented and validated. The Groq-hosted model returns JSON with recommendations, tips, savings and insights; the response is validated, stored in ai_recommendations and displayed in the AI Insights module. Savings stated by the model can be crosschecked with the calculated ΔE.
6. Leaderboard and Badge Score (Design only, requires ≥2 months) – Purpose: Ranks users fairly across different lifestyles.
Su = (Ebase − Ecurrent) / Ebase × 100 (9)
How it works: The score is the percentage reduction relative to the user’s own baseline month, so a user who starts with a high footprint is not disadvantaged. Badges are awarded when S passes defined thresholds. The score and thresholds u are design choices of this prototype, and a baseline and a later month are both needed to compute them.
7.Planned Evaluation Metrics – Purpose: Will measure prediction error on held-out months once time-ordered validation on real data exists.
MAE = (1/n) Σ |y − ŷ| (10)
RMSE = √( (1/n) Σ (y − ŷ)² ) (11)
MAPE = (100/n) Σ |y − ŷ| / y (12)
R² = 1 − Σ (y − ŷ)² / Σ (y − ȳ)² (13)
How it works: y is the actual and ŷ the predicted monthly footprint over n test samples. MAE and RMSE are in kg CO2e, MAPE is in percent, and R² measures the share of variance explained. These metrics have not been computed for this paper.
4. Results
Dataset. The pilot dataset comprised activity records from 10 users over a one-month period, from September 1 to September 30, 2026. A total of 14 activities were recorded during this period. The dataset was used to examine user activity records and the corresponding carbon footprint calculations.
Experimental Result. The dataset recorded total emissions of 112.51 kg CO2e. Across all 10 users, the mean emission was 11.25 kg CO2e per user, with a minimum of 0.00 kg CO2e and a maximum of 91.80 kg CO2e. Among active users, the mean emission was 22.50 kg CO2e per user, with a minimum of 1.92 kg CO2e and a maximum of 91.80 kg CO2e. The consumption category accounted for the largest reported share of emissions, at 53.3%.
TABLE 1. Descriptive Results of the Pilot Dataset
| Item | Value |
| Users | 10 |
| Period | 1 month (September 1–30, 2026) |
| Total activities logged | 14 |
| Total emissions (kg CO2e) | 112.51 |
| Mean / min / max per user (kg CO2e) |
[All 10 users] 11.25 / 0.00 / 91.80 [Active users] 22.50 / 1.92 / 91.80 |
| Largest category by share | Consumption, 53.3% |
| Calculation check (handcomputed vs. system output) | 14 of 14 samples matched (100.0%) |
Any further statement about the results, such as which category dominated, must come directly from Table 1. The earlier synthetic experiment (300 users, 36 months) is not part of the results and is not evidence about real users.
5.1 Advantages
1.Complete Tracking Workflow – Users move from adding activities to history, insights, predictions and recommendations inside one application.
2.Transparent Calculation – Every figure can be traced to an activity quantity and a stored factor in the emission_factors table, which can be updated without changing code.
3.Forward-Looking Insight – The Predictions module shows the expected footprint for next month, so users can act before it is reached.
4.Personalised, Natural-Language Guidance – The LLM turns the user’s own data into tips, insights and answers to questions, and the responses are stored for later viewing.
5.Lightweight Analytics – Random Forest and K-means run on a CPU in milliseconds, in line with the Green-AI principle of avoiding unnecessarily heavy models.
6.Motivation through Gamification – The leaderboard and badges give a visible reward for reducing emissions.
5.2 Limitations
1.Very Small Pilot Dataset – Only 10 users and one month. The results are descriptive and cannot be generalised.
2.No Forecasting Evidence – With a single month there is no temporal training or validation data, so no forecasting capability has been demonstrated.
3.Profiling Not Validated – K-means on 10 users cannot give meaningful or stable clusters.
4.Monthly Comparison and Leaderboard Not Testable Yet – Both need at least two months of data per user.
5.Illustrative Emission Factors – Factors in the examples are order-of-magnitude values; they must be verified against DEFRA, IPCC and CEA India for the user’s country and year before deployment.
6.LLM Output Quality and Dependence – LLM answers may be inaccurate, vary between calls or be unavailable if the external API or network fails; the quality of recommendations has not yet been evaluated.
7.Manual Data Entry – Self-reported activities are tedious and error-prone, and data quality affects every downstream result.
8.Key Handling – Because the interface includes an API key setting, the key must be stored and used on the server side and protected from exposure.
5. Discussion
TABLE 2. Comparative Analysis
|
The proposed carbon footprint tracker integrates multiple functions into a single platform, as illustrated in Fig. 1. Users can record their daily activities, calculate their estimated carbon emissions, review historical data, generate reports, and explore emission forecasts and user profiles. The platform also provides AI-assisted sustainability recommendations and gamification features to encourage environmentally responsible habits. Table 2 presents a comparison of the proposed system with existing approaches discussed in Section II. This comparison is based on information reported in the reviewed literature and does not represent independent testing of those systems. The synthetic results should be read carefully. Random Forest was best on MAE and MAPE, but its advantage over Ridge regression is small, and the feature importance was dominated by last month’s total (0.99) because emissions in the generated data are persistent. The perfect clustering result reflects synthetic separability. The LLM part, which is central to the user experience, still needs evaluation of relevance, factual accuracy, JSON validity and response time with real prompts.
5.3 Future Work
To extend the tracker, several steps are earmarked:
- Longer Data Collection – Collect at least 6–12 months of activity records from a larger user group, with consent.
- Forecast Validation – Train the Random Forest on earlier months and test on later ones. Compare against a last-month baseline and a moving average, and report MAE, RMSE and MAPE only from these real results.
- Profiling – Apply K-means once enough users exist, and check cluster stability.
- LLM Evaluation – Rate the relevance and factual accuracy of AI recommendations, measure JSON validity rate and response time, and compare with rule-based tips.
- Pilot User Study – A four-week study with students and staff measuring usability with the System Usability Scale (SUS), recommendation usefulness, change in monthly emissions and a pre/post attitude questionnaire.
- Calibrated Emission Factors – Checking every factor against official sources (DEFRA, IPCC and the Central Electricity Authority for India) and updating them regularly.
7.Automatic Data Capture and Explainable
Recommendations – Reducing manual entry through trip detection and utility-bill upload, and showing the calculation behind each suggested saving so that users can trust and verify it.
6. Conclusion
This paper presents the design and prototype of an AI-Based Personal Carbon Footprint Tracker built with React, Tailwind CSS, Vite, PHP and MySQL. The implemented core lets users record activities and estimate emissions using Emission = Quantity × Emission Factor, with category-wise breakdowns and LLM-assisted recommendations. The prototype was tested on 10 users over one month, so the evaluation is limited to the implemented features and describes the pilot data only. Random Forest next-month prediction, K-means profiling and monthover-month comparison are proposed extensions. They have not been validated, and no forecasting accuracy is claimed. Future work will collect longer-term data from more users, validate emission factors against official sources, evaluate the AI-generated recommendations, and test forecasting with proper time-ordered validation.
Copyright and Licence
The authors retain copyright and agree to publication under the journal’s Creative Commons Attribution 4.0 International (CC BY 4.0) licence, subject to acceptance.